- Motivation
- Go package for trace
- Preparation
- Add trace code into main function
- Run app-operator locally outside the cluster
- Reference link
Motivation
Generate visual calltrace (from trace data) to help understanding the scaffold code generated by operator-sdk.
Go package for trace
Golang community offers package runtime/trace for go code tracing.
Even though runtime/trace is not targeted as code callgraph generation tool (it’s for go code runtime performance diagnose), we could still use it to generate visual calltrace based on the trace data.
BTW, there is another tool https://github.com/TrueFurby/go-callvis which offers much better support for gocode callgraph visualization.
Preparation
Follow the guide from “Quick Start”: https://github.com/operator-framework/operator-sdk#quick-start, install the operator SDK and generate the example “app-operator”
Add trace code into main function
Go package runtime/trace can be used to generate traces for Go executive.
Helper code as below is added to app-operator/cmd/manager/main.go to trigger trace:
import 	(
  ...
+    "runtime/trace"
+    olog "log
  ...
)
...
func main() {
// Add the zap logger flag set to the CLI. The flag set must
// be added before calling pflag.Parse().
pflag.CommandLine.AddFlagSet(zap.FlagSet())

// Add flags registered by imported packages (e.g. glog and
// controller-runtime)
pflag.CommandLine.AddGoFlagSet(flag.CommandLine)

pflag.Parse()

+	f, err := os.Create("trace.out")
+	if err != nil {
+		olog.Fatalf("failed to create trace output file: %v", err)
+	}
+	defer func() {
+		if err := f.Close(); err != nil {
+			olog.Fatalf("failed to close trace file: %v", err)
+		}
+	}()
+
+	if err := trace.Start(f); err != nil {
+		olog.Fatalf("failed to start trace: %v", err)
+	}
+	defer trace.Stop()
  ...
Run app-operator locally outside the cluster
Trace will not write to outputfile until trace.Stop() get called, send a “Ctrl+C” to running app-operator is the simplest way to trigger trace.Stop(). Deploy the app-operator as a container inside the cluster is not convenient to send “Ctrl+C” and collect the outputfile, let’s run the app-operator locally outside the cluster
Set environment
export OPERATOR_NAME=app-operator
Run the operator locally with default Kubernetes config file present at $HOME/.kube/config:
$ operator-sdk up local --namespace=default
INFO[0000] Running the operator locally.
INFO[0000] Using namespace default.
{"level":"info","ts":1559037682.2133474,"logger":"cmd","msg":"Go Version: go1.12.5"}
{"level":"info","ts":1559037682.2134213,"logger":"cmd","msg":"Go OS/Arch: linux/amd64"}
{"level":"info","ts":1559037682.2134311,"logger":"cmd","msg":"Version of operator-sdk: v0.7.0+git"}
{"level":"info","ts":1559037682.2285535,"logger":"leader","msg":"Trying to become the leader."}
{"level":"info","ts":1559037682.2287834,"logger":"leader","msg":"Skipping leader election; not running in a cluster."}
{"level":"info","ts":1559037682.270012,"logger":"cmd","msg":"Registering Components."}
{"level":"info","ts":1559037682.2702484,"logger":"kubebuilder.controller","msg":"Starting EventSource","controller":"appservice-controller","source":"kind source: /, Kind="}
{"level":"info","ts":1559037682.2704332,"logger":"kubebuilder.controller","msg":"Starting EventSource","controller":"appservice-controller","source":"kind source: /, Kind="}
{"level":"info","ts":1559037682.294,"logger":"metrics","msg":"Skipping metrics Service creation; not running in a cluster."}
{"level":"info","ts":1559037682.2940252,"logger":"cmd","msg":"Starting the Cmd."}
{"level":"info","ts":1559037682.395666,"logger":"kubebuilder.controller","msg":"Starting Controller","controller":"appservice-controller"}
{"level":"info","ts":1559037682.497708,"logger":"kubebuilder.controller","msg":"Starting workers","controller":"appservice-controller","worker count":1}
{"level":"info","ts":1559037682.4978557,"logger":"controller_appservice","msg":"Reconciling AppService","Request.Namespace":"default","Request.Name":"example-appservice"}
{"level":"info","ts":1559037682.497939,"logger":"controller_appservice","msg":"Skip reconcile: Pod already exists","Request.Namespace":"default","Request.Name":"example-appservice","Pod.Namespace":"default","Pod.Name":"example-appservice-pod"}
Send “Ctrl+C” and check the outputfile trace.out
$ ls -l trace.out
-rw-rw-r--. 1 centos centos     16 May 28 10:01 trace.out
Oops!!! File size is not reasonable, it seems “Ctrl+C” is not received by app-operator, app-operator is started by operator-sdk, “Ctrl+C” is not delivered to app-operator.
Let run the app-operator directly.
Above operator-sdk up local --namespace=default generates build/_output/bin/app-operator-local, run app-operator-local directly with ENV variable WATCH_NAMESPACE=default and send “Ctrl+C”
$ WATCH_NAMESPACE=default build/_output/bin/app-operator-local
{"level":"info","ts":1559038979.0648825,"logger":"cmd","msg":"Go Version: go1.12.5"}
{"level":"info","ts":1559038979.0649567,"logger":"cmd","msg":"Go OS/Arch: linux/amd64"}
{"level":"info","ts":1559038979.0649745,"logger":"cmd","msg":"Version of operator-sdk: v0.7.0+git"}
{"level":"info","ts":1559038979.0666668,"logger":"leader","msg":"Trying to become the leader."}
{"level":"info","ts":1559038979.0668905,"logger":"leader","msg":"Skipping leader election; not running in a cluster."}
{"level":"info","ts":1559038979.1056824,"logger":"cmd","msg":"Registering Components."}
{"level":"info","ts":1559038979.1059065,"logger":"kubebuilder.controller","msg":"Starting EventSource","controller":"appservice-controller","source":"kind source: /, Kind="}
{"level":"info","ts":1559038979.1060324,"logger":"kubebuilder.controller","msg":"Starting EventSource","controller":"appservice-controller","source":"kind source: /, Kind="}
{"level":"info","ts":1559038979.1298842,"logger":"metrics","msg":"Skipping metrics Service creation; not running in a cluster."}
{"level":"info","ts":1559038979.129916,"logger":"cmd","msg":"Starting the Cmd."}
{"level":"info","ts":1559038979.2303512,"logger":"kubebuilder.controller","msg":"Starting Controller","controller":"appservice-controller"}
{"level":"info","ts":1559038979.330573,"logger":"kubebuilder.controller","msg":"Starting workers","controller":"appservice-controller","worker count":1}
{"level":"info","ts":1559038979.3307297,"logger":"controller_appservice","msg":"Reconciling AppService","Request.Namespace":"default","Request.Name":"example-appservice"}
{"level":"info","ts":1559038979.3308117,"logger":"controller_appservice","msg":"Skip reconcile: Pod already exists","Request.Namespace":"default","Request.Name":"example-appservice","Pod.Namespace":"default","Pod.Name":"example-appservice-pod"}
^C{"level":"info","ts":1559039030.7725067,"logger":"kubebuilder.controller","msg":"Stopping workers","controller":"appservice-controller"}
Check the outputfile:
$ ls trace.out -l
-rw-rw-r--. 1 centos centos 189672 May 28 10:23 trace.out
Trace is generated successfully, check it with go tool trace
$ go tool trace trace.out
2019/05/28 10:35:22 Parsing trace...
2019/05/28 10:35:22 Splitting trace...
2019/05/28 10:35:22 Opening browser. Trace viewer is listening on http://127.0.0.1:35960
Browser is open with the page including trace view.
Generate a pprof-like profile from the trace:
$ go tool trace --pprof=sched trace.out > sched.pprof
Use pprof tool to analyze the profile:
$ go tool pprof sched.pprof
Main binary filename not available.
Type: delay
Entering interactive mode (type "help" for commands, "o" for options)
(pprof) o
call_tree = false
compact_labels = true
cumulative = flat //: [cum | flat]
divide_by = 1
drop_negative = false
edgefraction = 0.001
focus = ""
granularity = filefunctions //: [addresses | filefunctions | files | functions | lines]
hide = ""
ignore = ""
mean = false
nodecount = -1 //: default
nodefraction = 0.005
noinlines = false
normalize = false
output = ""
prune_from = ""
relative_percentages = false
sample_index = delay //: [contentions | delay]
show = ""
show_from = ""
tagfocus = ""
taghide = ""
tagignore = ""
tagshow = ""
trim = true
trim_path = ""
unit = minimum
(pprof) nodecount=0
(pprof) nodefraction=0
(pprof) edgefraction=0
(pprof) call_tree=true
(pprof) web
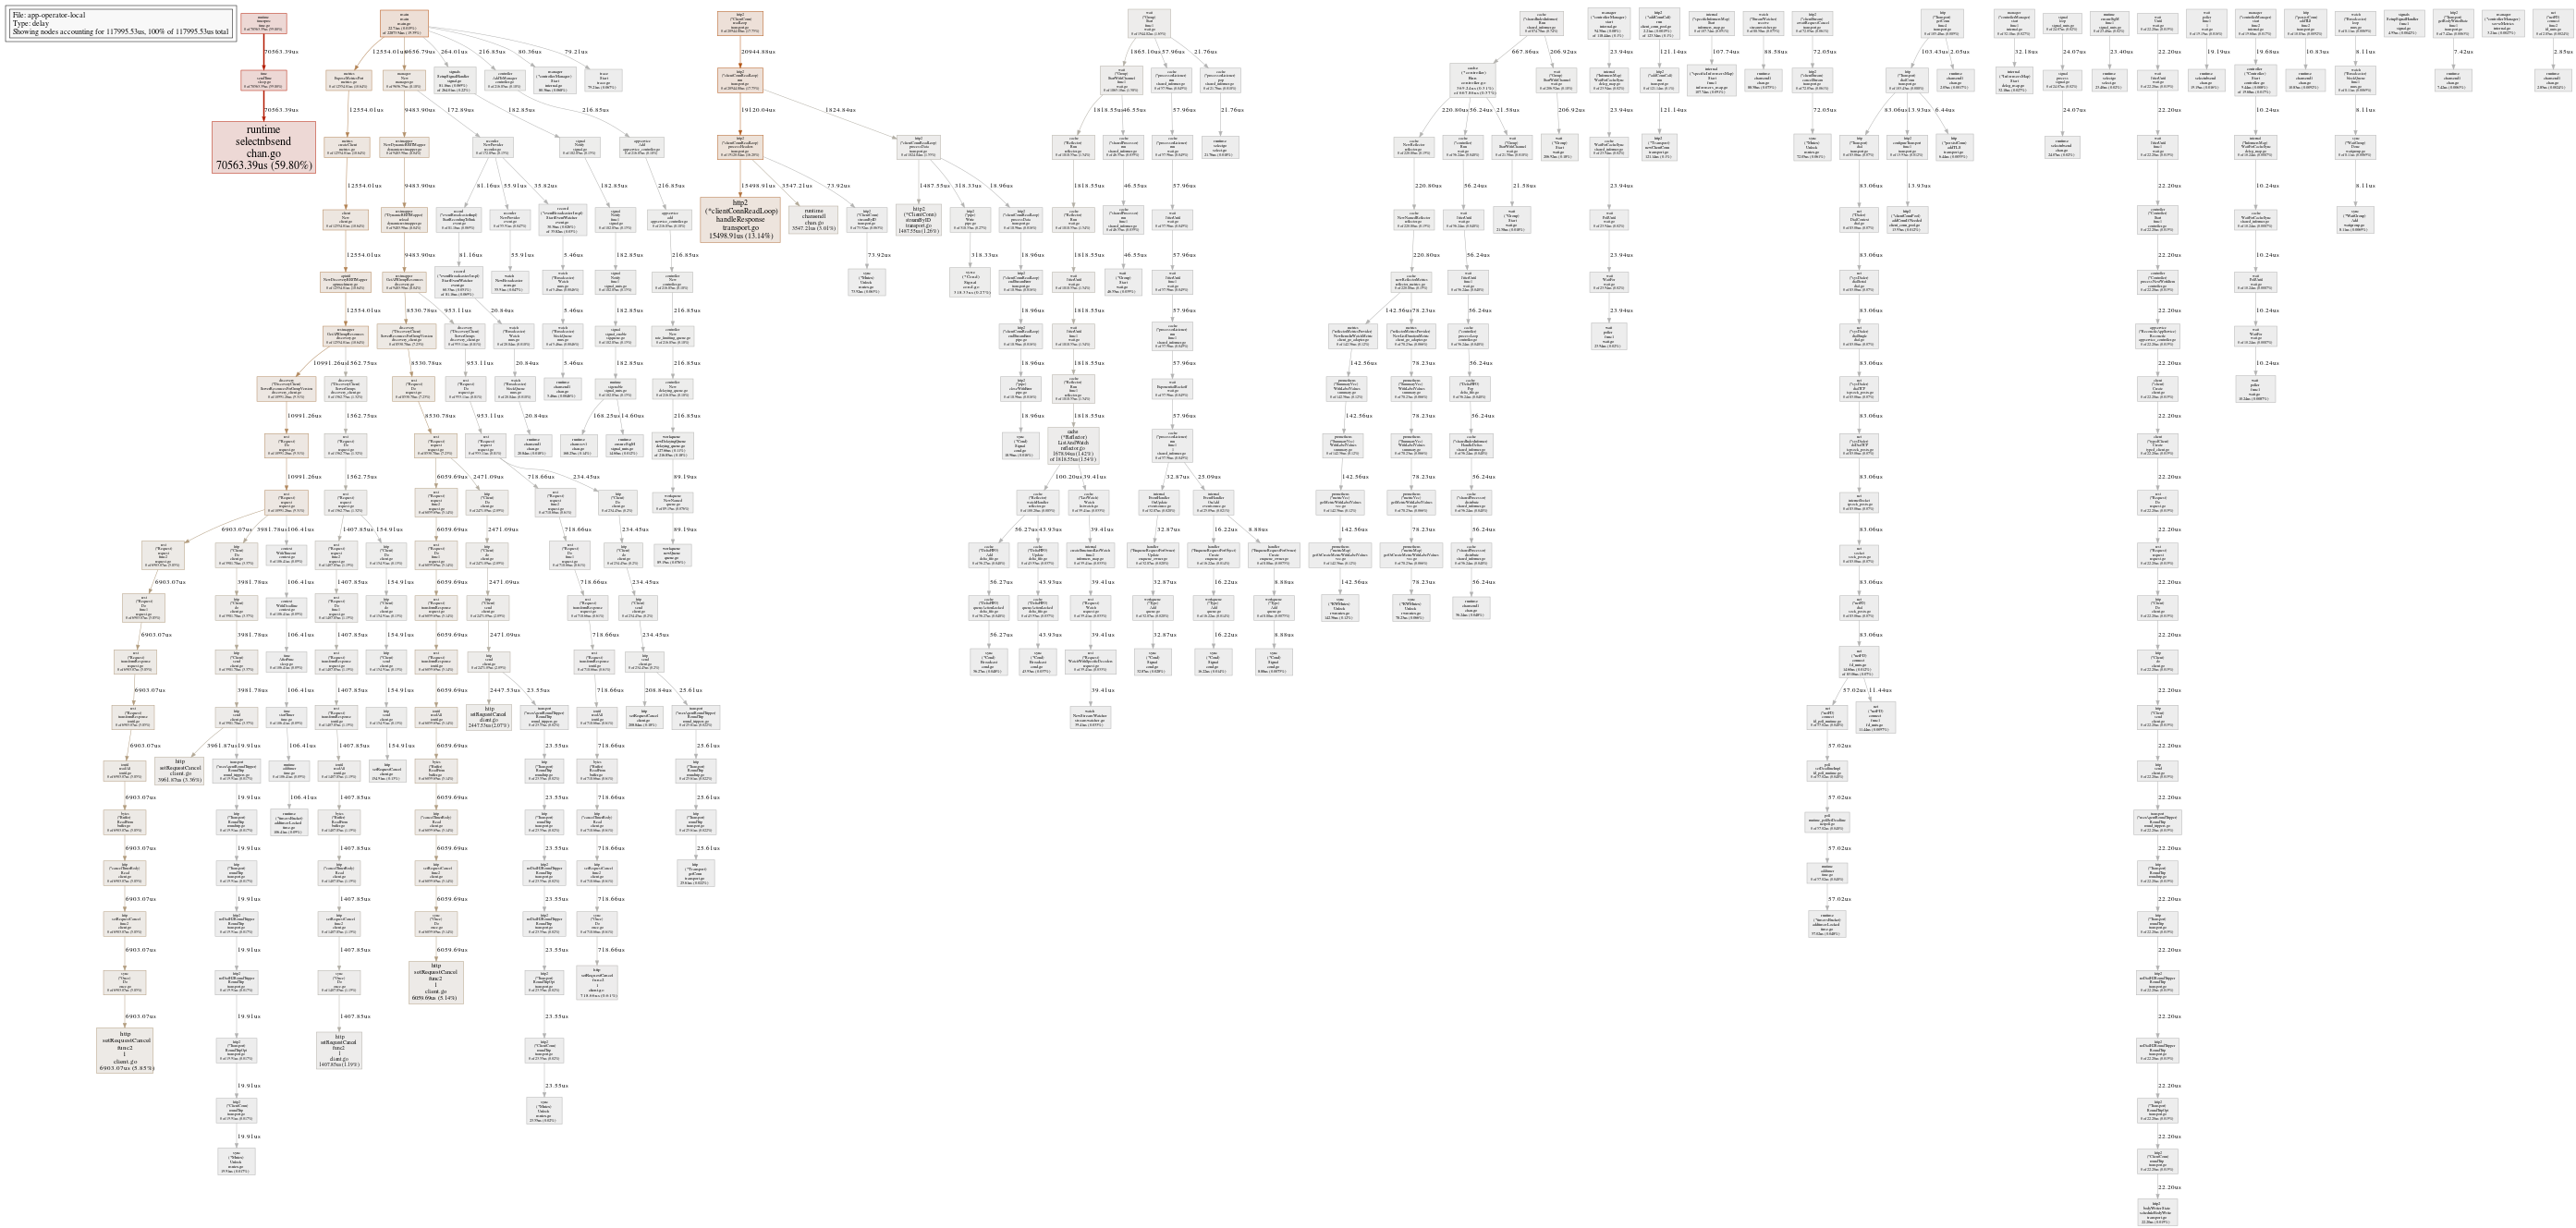
(pprof) png
Here nodecount, nodefraction, edgefraction set to 0, no node/edge is ignored when generate graph. web open the trace graph in web browser, png save the trace graph to png.
Since “sched” type trace is selected, in below output graph, it shows the calltraces for go-routine.